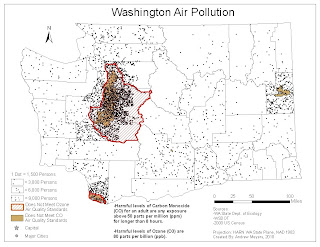
This map is a dot density map for Washington State. Also added are two layers that show air quality information for Ozone (O3) and Carbon Monoxide (CO). It is easy to see the correlation between population density and the areas of poor air quality. This map is intended to be used by the general public and officials in Washington State’s Department of Ecology. The local residents may use this map to see if the area they live in is polluted and people who plan on moving may use it to decide on an area to live in. The data was gathered from the Washington State Department Ecology, so it would useful to people in that department to see the correlation between their data and the population distribution of the state.

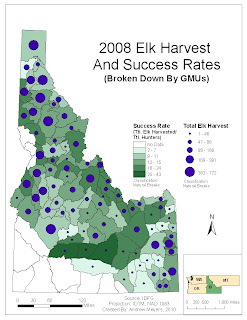
This map is a map showing hunter success and number of elk harvested in Idaho Game Management Units (GMU) during the 2008 hunting season. The data for the map was gathered from Idaho Fish and Game’s (IDFG) website. This map will be useful for hunters and wildlife managers. It will help hunters decide on a unit in which they may want to concentrate their time and effort. For wildlife managers it will help them see which units are producing the best elk hunting opportunities. They may then decide to study this area and see why it is so productive for elk and if they can copy these conditions in other units.
No comments:
Post a Comment